
Government of Canada; Environment and Climate Change Canada; Canadian Environmental Sustainability Indicators
Type of resources
Topics
Keywords
Contact for the resource
Provided by
Years
Formats
Representation types
Update frequencies
status
-
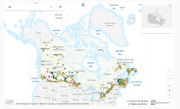
The Canadian Environmental Sustainability Indicators (CESI) program provides data and information to track Canada's performance on key environmental sustainability issues. The Water quality in Canadian rivers indicators provide a measure of the ability of river water across Canada to support plants and animals. At each monitoring site, water quality data are compared to water quality guidelines to create a rating for the site. If measured water quality is below the guidelines, it can maintain a healthy ecosystem. Water quality at a monitoring site is considered excellent when substances in a river are very rarely measured above their guidelines. Conversely, water quality is rated poor when measurements are usually above their guidelines, sometimes by a wide margin. These indicators provide information about the state of surface water quality and its change through time, to support water resource management. Information is provided to Canadians in a number of formats including: static and interactive maps, charts and graphs, HTML and CSV data tables and downloadable reports. See the supplementary documentation for the data sources and details on how the data were collected and how the indicator was calculated. Canadian Environmental Sustainability Indicators - Home page: https://www.canada.ca/environmental-indicators
-
The Canadian Environmental Sustainability Indicators (CESI) program provides data and information to track Canada's performance on key environmental sustainability issues. The Municipal wastewater treatment indicator measures the level of wastewater treatment provided to the Canadian population. Higher levels of wastewater treatment reduce the risk of pollutants from raw wastewater reaching the environment, where they pose risks to human and environmental health. This indicator is not a measure of municipalities' compliance with municipal, provincial or federal wastewater regulations or treatment standards. Information is provided to Canadians in a number of formats including: static and interactive maps, charts and graphs, HTML and CSV data tables and downloadable reports. See the supplementary documentation for data sources and details on how those data were collected and how the indicator was calculated. Canadian Environmental Sustainability Indicators: https://www.canada.ca/environmental-indicators
-
The Canadian Environmental Sustainability Indicators (CESI) program provides data and information to track Canada's performance on key environmental sustainability issues. The Reductions in phosphorus loads to Lake Winnipeg indicator shows the estimated extent to which projects funded by the Lake Winnipeg Basin Stewardship Fund (from April 2008 to March 2017) and the Lake Winnipeg Basin Program (since March 2017) have reduced the amount of phosphorus reaching the lake from its watershed. Reducing the amount of nutrients, such as phosphorus, reaching Lake Winnipeg will help improve the health of the lake. Information is provided to Canadians in a number of formats including: static and interactive maps, charts and graphs, HTML and CSV data tables and downloadable reports. See the supplementary documentation for the data sources and details on how the data were collected and how the indicator was calculated. Canadian Environmental Sustainability Indicators: https://www.canada.ca/environmental-indicators